Forecasting in the electrical grid
A. Uncertainty in the electrical grid
In today’s electrical grid, as the integration of renewable energy sources (RES) in the grid increases, the uncertainty in the available generation also rises. In particular, the larger the share of RES in the grid, the more dependent is the electricity generation on weather conditions, and in turn, the more unpredictable electricity generation becomes. This uncertainty also affects the demand side as electricity consumption is also weather-dependent and every unit of produced energy must be consumed somewhere.
In this context, in order to cope with the uncertainty in the production and demand of electricity, forecasting has become a key component in several applications, e.g. reserve activation, electricity trading, operational planning, switching sources, programming backup, short-term power trading, peak load matching, scheduling of power systems, congestion management, etc.
B. What do we need to forecast?
Traditionally, most of the forecasting research that has been performed in the context of the electric grid has focused on four key variables: electricity demand [1,2], electricity prices [3,4,5], wind-based generation [6,7], and solar-based generation [8,9]. While there might be other important variables influencing the electrical grid, these four quantities are arguably the most important for utility companies and the transmission system operator.
i) Electricity Demand
From the point of view of a transmission system operator, knowing the demand of electricity is paramount for scheduling power systems, purchasing reserves, congestion management, and ensuring that cost are minimized while the demand of electricity is ensured (even though failures in the system might happen). Similarly, utility companies might also benefit from electricity demand forecasting in several ways, e.g. operational planning.
ii) Electricity Prices
In recent years, together with the increasing integration of RES, the volatility of electricity prices has also surged. In this context, accurate forecasting of electricity prices is of paramount importance to utility companies for successfully trading electricity, scheduling and planning processes, and programming backups.
iii) Solar/Wind Generation
Among the RES that are weather dependent and in turn uncertain, wind and solar sources represent the largest share in the energy mix. In particular, if we consider the European Union, wind and solar-based generation respectively represent the second and third largest share of RES, only below hydro power which is much less weather-dependent and less uncertain.
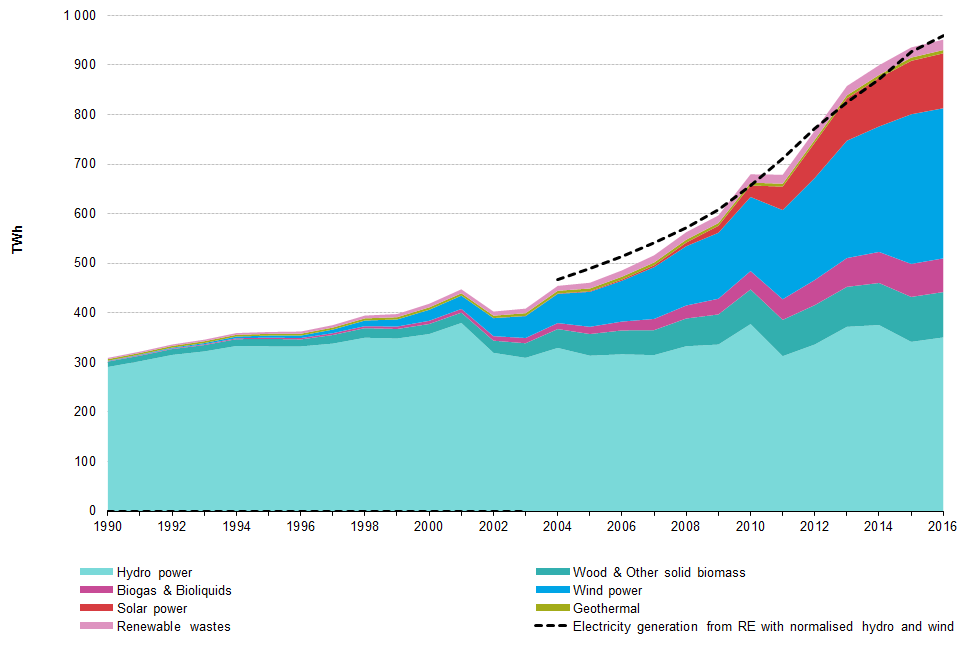
Gross electricity generation from renewable sources in the EU-28 [10]
As a result, accurate forecasting of wind and solar generation is crucial for both utility companies and the transmission system operator: as before, the transmission system operator needs to forecast the wind and solar generation in order to purchase reserves, anticipate possible congestions, scheduling power systems, etc. Likewise, for utility companies, these forecasts are essential in order to perform power trading and process planning.
C. Long vs. short-term forecasts
One of the distinctions that is typically made in terms of forecasting methods regards the prediction horizon. Usually, a distinction is made between forecasts that are made for short-term horizons and forecasts which employ long-term horizons. While this separation can be observed across the different forecasting fields, the meaning of short-term vs long-term does not have a standardized meaning.
For instance, in the literature of electricity prices, due to structure of the electricity markets, short-term forecasting typically implies prediction horizons that range from a day-ahead to nearly real-time, while long-term forecasting usually refers to months and years ahead. In addition, short-term forecasting is usually employed for day to day trading while long term forecasting typically involves strategic planning.
By contrast, when referring to solar generation, the division between short and long term forecast is made based on the family of models used. Short-term forecasting is characterized by prediction horizons below 6 hours and by forecasting techniques based either on time series models using ground data or on cloud vector models using satellite images. When the prediction horizon is larger than 6 hours, the described techniques are no longer accurate, and in this new time frame, numerical weather based models are required. In particular, numerical weather based models are employed to forecast solar radiance ranging from 6 hours to 1-2 weeks ahead.
D. Point vs. probability forecasts
Another distinction that is usually made is between point and probability forecasts, i.e. between forecasting an expected value or forecasting the probability distribution of the variable of interest.
D.1 Point Forecasting
A point forecast of the variable of interest represents the expected or “more likely” value of the variable, where the expected value is typically represented by the mean or the median of the variable. Due to the scalar nature of point forecasts, its usage in the context of electricity has been larger than that of probability forecasts. Particularly, as practitioners only need to consider a single forecast value and not a probability distribution, the integration of point forecasts into operational planning, decision making, or power trading has been more widely adopted. For the same reason, a larger part of the forecasting literature is based on point forecasting, while the literature on probability forecasting is smaller.
An example of a point forecast model and its estimation is given as follow: let’s define the variable of interest by  , a forecast model of by
  , with
  as the model exogenous inputs, and
  the model parameters. Then, given a set of observed measurements
 ![\bigl[(y_1,x_1),\ldots,(y_N,x_N))\bigr]](https://jesuslago.com/wp-content/ql-cache/quicklatex.com-50a75a00bf6a0675d8c124b83dd382da_l3.png "Rendered by QuickLaTeX.com") , a technique typically used to estimate the model is to minimizing the sum of squares of the observational errors, i.e.:
, a technique typically used to estimate the model is to minimizing the sum of squares of the observational errors, i.e.:
![\[ \mathrm{min}_{\theta} \sum_{i=1}^N ||y_i -M(\theta,x_i) ||. \]](https://jesuslago.com/wp-content/ql-cache/quicklatex.com-54ee63666249332f6e9c35f215fab3b3_l3.png "Rendered by QuickLaTeX.com")
This estimation has a particular statistical interpretation: assuming that the observations  have measurement errors
  , i.e.
  , and that the measurement errors
  are independent and follow a zero-mean Gaussian distribution, minimizing the above optimization problem is equivalent to maximizing the likelihood of the observed errors.
We can use a a real life point forecast example to further illustrate the concept. Given the historical demand in a country, we need to make the hourly day-ahead forecast of the electricity demand during the 9th of February. In this case, the exogenous inputs could be the demand over the previous days, and the model could be a simple linear models, i.e.  . Then, after estimating the parameter using historical data, the point forecast of the electricity demand would provide the expected electricity demand over the next 24 hours.
D.2 Probability Forecasting
In contrast with point forecasts, probability forecasting provides a representation of the probability distribution of the variable of interest. This distribution is usually given via a full parameterization or via quantile functions.
Full parameterization
A first method to build probability forecasts is based on estimating the parameterization of the probability density function (PDF) of the variable of interest. In particular, defining again by the variable of interest, by the parameterization of the PDF, and by some exogenous variables affecting , the method estimates the conditional density function  . The main drawback of this method is that it requires to make an assumption on the type of PDF that describes .
Quantile function
Given a random variable and a probability  , a quantile
  of is defined as the value at which the probability of is less than or equal to . In other words, defining the cumulative distribution function (CDF) of by
  , the quantile is equivalent to the value
  such that
  .
.
Using the above definition, the second methodology is based on estimating a series of quantile functions  that parameterize several quantiles of the variable of interest . In particular, to estimate the quantile functions, several methods exists, e.g. building empirical quantiles using historical errors, using quantile regression, etc [10].
An important thing to note is that, within the probability forecasting methods, sometimes a third methodology is presented: prediction intervals. However, prediction intervals are nothing else than a probability forecast involving two quantiles, i.e. quantile functions are a generalization of prediction intervals.
Example
An with the point forecast, we can use the example of the day-ahead electricity demand forecast on the 9th of February. In this case, a probability forecast of the electricity demand would provide the probability distribution of the electricity demand over the next 24 hours. In the graph below, the probability distribution is simply represented via 9 quantile functions modeling the following 9 quantiles: 0.01, 0.05, 0.10, 0.25, 0.50, 0.75, 0.9, 0.95, 0.99.
D.3 Scenario Generation
In addition to point and probability forecasting, there is a third family of methods called scenario generation. The basic idea is that, while the described methods for probability forecasting do provide a probability distribution of the variable of interest, they assume that multi-horizon predictions are uncorrelated. In particular, if a probabilistic forecasting model is employed to predict a variable over the next  time points, the model will typically consider probability distributions and assume that they are independent.
In the context of electricity, the variables of interest are time series data; therefore, the assumption of having independent probability distributions does not necessarily hold. To address this issue, scenario generation builds a representation of the interdependencies between the time points. In particular, it first models the correlation of the variable of interest at the different time horizons, and then it generates a series of statistical scenarios (also known as traces) that takes into account this interdependence.
In the case of scenario generation, the body of literature is even much more shorter than that of probability forecasting. One of the first and most successful methods to build statistical scenarios is [7], where the statistical scenarios are generated based on the transformation of random variables into a single multivariate Gaussian variable, and where the short-term forecasting of the wind power is used as a case study.
As before, we can use the example of the day-ahead electricity demand forecasting to represent this method. In this case, as shown in the plot below, scenario generation produces a series of traces representing possible instantiations of the variable of interest on the day-ahead.
E. Conclusion
The body of work of forecasting in the context of electricity and the electrical grid is very wide. In this short blog post we did not intend to cover the specifics in too much detail, but simply provide an overview of the different concepts related to forecasting. If the reader is interested on the details of forecasting models, model estimation, or forecast evaluation, the references provided in this post are a very good starting point.